
How to add Power BI dashboards to Dynamics 365: A Step-by-Step Guide
Tutorial: How to add Power BI dashboards to Microsoft Dynamics 365
Microsoft Dynamics 365 Sales already includes a built-in dashboarding feature with acceptable charts, lists and basic drill-down capabilities. By default, the Dashboards page will be the first thing most users see when they log in through the web interface:

But these dashboards pale in comparison with the full capabilities and superior aesthetics of Microsoft’s flagship analytics platform, Power BI. The good news is that you can add a fully functioning pre-built Power BI dashboard to Microsoft Dynamics 365 using your own data, and appearing totally seamless as if it had been part of it all along. The even better news is that it’s easy, quick, and completely FREE.
Let’s get to it!
Step 1: Get Power BI
If you don’t have Microsoft Power BI yet, click here to get it. The button might say something like “Try Free” but don’t worry, it’s not a limited-time trial. Click here to see the pricing page describing what the free edition gets you, as well as the more advanced paid editions.
You do not need to download the “Power BI Desktop” edition. It’s a powerful interface for more advanced Power BI customizations, but not necessary for the purposes of this article. For now let’s stick with the web-only interface, which after login will look something like this:
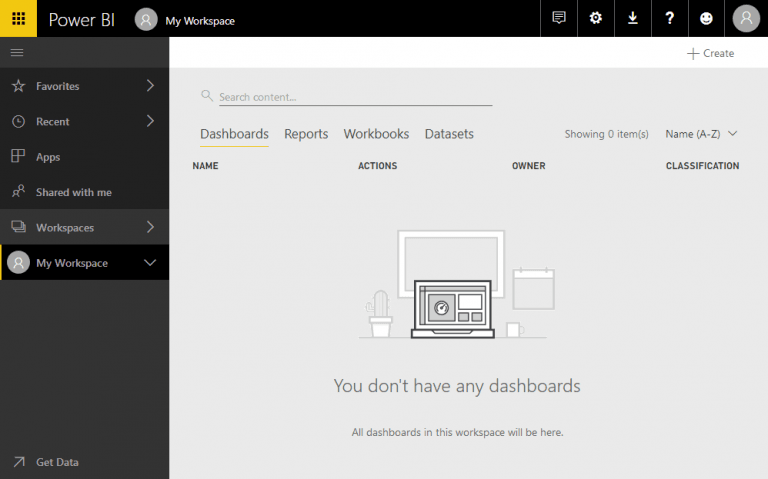
Step 2: Find the right Connector or “App” for Power BI
Find and click the “Get Data” button. As of this writing it is located in the bottom-left corner of the page.
The AppSource window will appear. Scroll down, or better yet, type “Dynamics 365” in the search bar:
As you can see in the image above, there are applications for many different online platforms, which is one of the features that makes Power BI so… well, powerful. You can gather data from multiple data sources outside of Dynamics 365, and visualize it neatly in dashboards within one single interface.
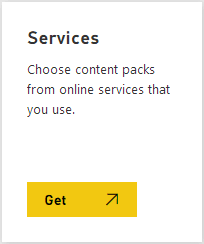
There are Apps available for various parts of Dynamics 365 including Sales, Financials, Marketing, Social Engagement, etc. For the purposes of this guide, we’ll choose “Sales Analytics for Dynamics 365”, and click “Get it now”.
Step 3: Connect Power BI
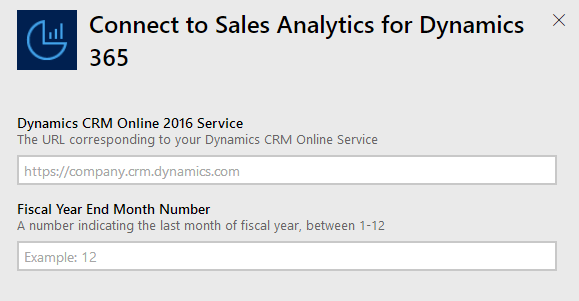
In the following dialog, enter the appropriate URL for your Dynamics 365 organization, and last month of the organization’s Fiscal Year:
If you’re connecting to Dynamics 365 Online, simply enter the normal URL you’d use to log in from your browser. For example, if my organization name is “Contoso”, I would enter: https://contoso.crm.dynamics.com
If you’re connecting to Dynamics 365 on-premises, unfortunately there are a few more technical steps required. Please refer to this article for more details.
Then if the Contoso organization’s fiscal year runs January through December, I would enter 12.
Click Next. If prompted, under Authentication Method, select oAuth2. Then wait while Power BI reads the data.
After waiting somewhere between several seconds to a few minutes (depending on how much data your organization has), Power BI will show the new Dashboard. It may look grayed-out while it’s reading the data, but it will show a white background and enabled buttons once it’s ready for consumption:

Step 4: Enable Power BI dashboards in Dynamics 365
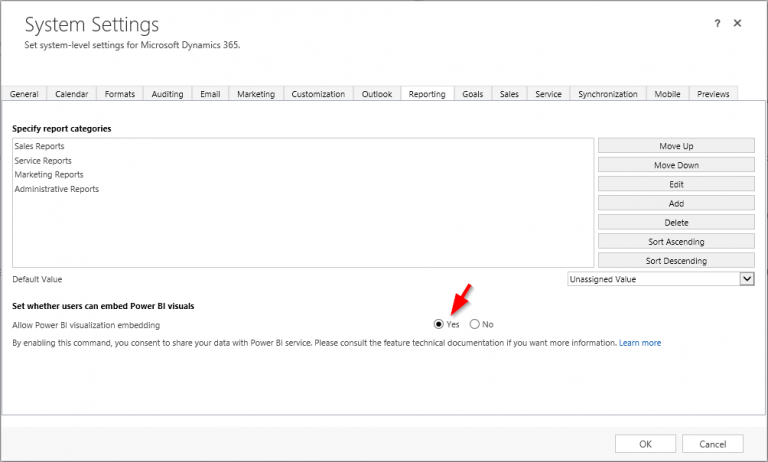
Log into the Dynamics 365 website, navigate to Settings > Administration > System Settings > Reporting tab, and under Set whether users can embed Power Bi visuals > Allow Power BI visualization Embedding, select Yes and click OK.
Step 5: Add the Power BI Dashboard
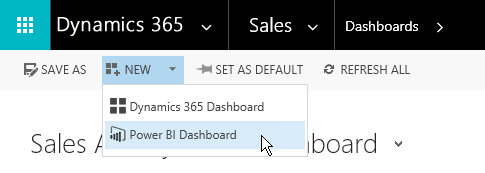
Still in Dynamics 365, navigate to Sales > Dashboards, then click the dropdown arrow next to the New button > Power BI Dashboard.
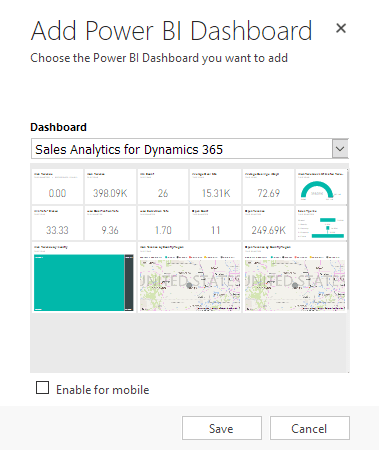
Click on the Dashboard dropdown and select the dashboard we created earlier. Click Save.
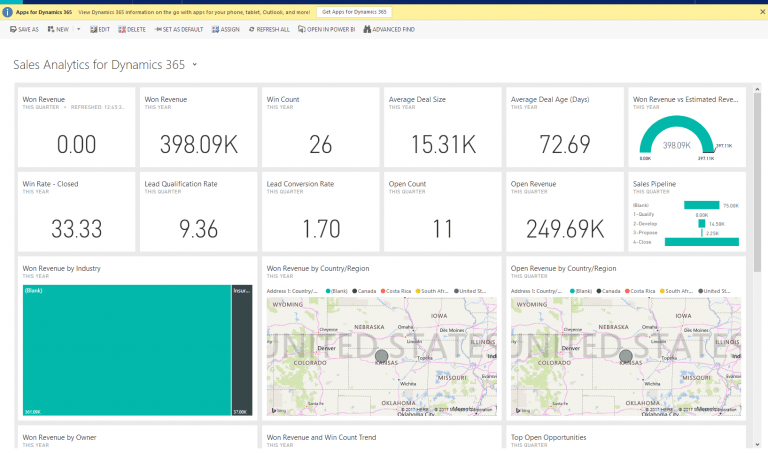
You will have to wait a bit for all the data to load and the dashboards to display for the first time, but then you will be rewarded with a great-looking live Power BI dashboard right inside Dynamics 365:
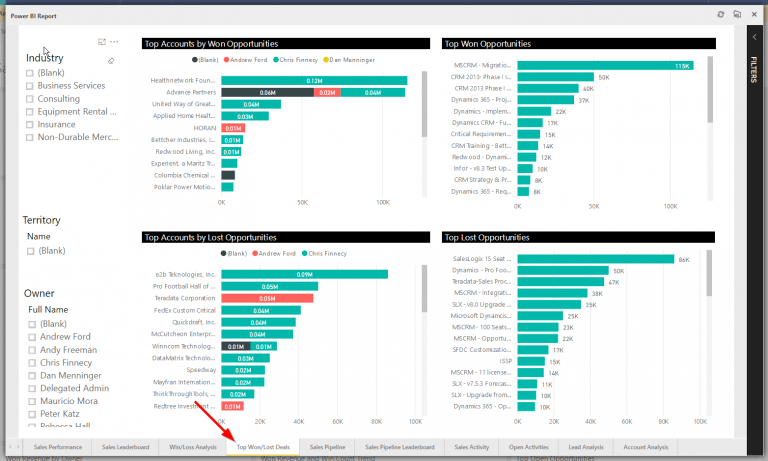
Furthermore, if you click on the dashboard itself, a pop-up window with the full “Power BI Report” will open, containing multiple dashboard tabs, each with a great amount of high-level as well as detailed information, which will give you an idea of the variety and capabilities behind the Power BI platform.:
PowerBi Dashboard FAQ
-
How do you customize the Power BI dashboards to reflect specific data points or KPIs that are unique to your business needs within Dynamics 365?
Microsoft Power BI provides an exceptionally flexible platform that empowers users to tailor dashboards and reports to meet their unique business requirements when integrated with Dynamics 365. This customization capability is a testament to Microsoft's commitment to providing versatile business intelligence solutions. Power BI's intuitive design interface allows users to drag and drop elements, creating personalized dashboards that highlight specific data points or Key Performance Indicators (KPIs) relevant to their business operations. The platform's advanced analytics tools enable deep dives into data, offering insights that can drive strategic decisions. This level of customization ensures that businesses can leverage their data in the most effective way possible, making informed decisions that are aligned with their goals and operational needs. -
What are the limitations of the free edition of Power BI when integrated with Dynamics 365, and how do these limitations compare with the paid editions?
The free edition of Power BI, when integrated with Microsoft Dynamics 365, offers a robust set of features that provide significant value for businesses looking to harness the power of data analytics without additional cost. Microsoft has designed the free version to be incredibly generous, allowing for the creation and sharing of dashboards and reports that can transform the way businesses interact with their data. While the paid editions of Power BI unlock even more powerful capabilities, such as greater data capacity, refresh rates, and additional collaboration tools, the free edition represents an excellent starting point for organizations embarking on their data analytics journey. The seamless integration between Power BI and Dynamics 365, even at the free level, underscores Microsoft's dedication to making advanced analytics accessible to businesses of all sizes. -
How can Dynamics 365 data security and access permissions be managed within Power BI to ensure that sensitive data is only accessible to authorized users?
Ensuring the security of sensitive data and managing access permissions with precision is a cornerstone of the integration between Power BI and Microsoft Dynamics 365. Microsoft has built these platforms with security at the forefront, allowing for detailed control over who can access specific pieces of data. Within Power BI, administrators can manage user permissions, ensuring that only authorized personnel have access to sensitive information. This level of security governance extends to the integrated experience with Dynamics 365, where data access can be finely tuned according to role and necessity. The integration respects existing Dynamics 365 security models, ensuring a seamless and secure flow of information. This commitment to data security and access management reflects Microsoft's understanding of the critical importance of protecting business data while enabling productive and insightful analytics.


