
Dynamics 365
D365 Accelerators
Implementation

Microsoft Power BI is a powerful data visualization tool offered by Microsoft within their Power Platform. Similar to other tools such as Tableau and Qlik, Power BI allows analysts, power users, and developers connect to multiple data sources producing visualizations that help decision-makers understand their business.
Since 2011, Microsoft has consistently added functionality making it what it is today – powerful, easy-to-use, and the industry-leader as referenced in Gartner’s latest report. In this blog, we’ll take you through 5 reasons why you should use Microsoft Power BI in your business compared to alternatives such as SQL Server Reports, built-in Dynamics 365 dashboards, and Microsoft Excel.
Among the analytics platforms that have been launched over the past 10 years, Power BI has the easiest point of entry for IT professionals and advanced application users. Few tools make it as easy to get started as Power BI does. Traditional “power users” familiar with Microsoft’s low-code development suite can get started with minimal training. If you’re not a Power User, Microsoft hosts “Dashboard In a Day” workshops designed to help all users build impactful reports.
The Power BI Desktop tool is free. The Desktop tool allows anyone to build visualizations and share them with other users via a file share server. When you’re ready to launch Power BI company-wide, you can upgrade to cloud-based Power BI Pro for $10 per user per month licensing. This price point is a significant advantage over competing technologies.
Beyond connectivity to Microsoft’s Dataverse and SQL Server, Power BI currently offers over 170 connectors that assist users in merging data from other systems into a single report. The connectors include Microsoft Cloud and on-premise products in addition to competitor sources, such as SalesForce, IBM, Oracle, and SAP.
The early releases of Power BI lacked features and functionality that would allow it to be a widely accepted business solution. However, over the past few years Microsoft has focused on making Power BI an industry-leading tool. The product is updated monthly with larger features included in Microsoft’s Release Waves for the Power Platform.
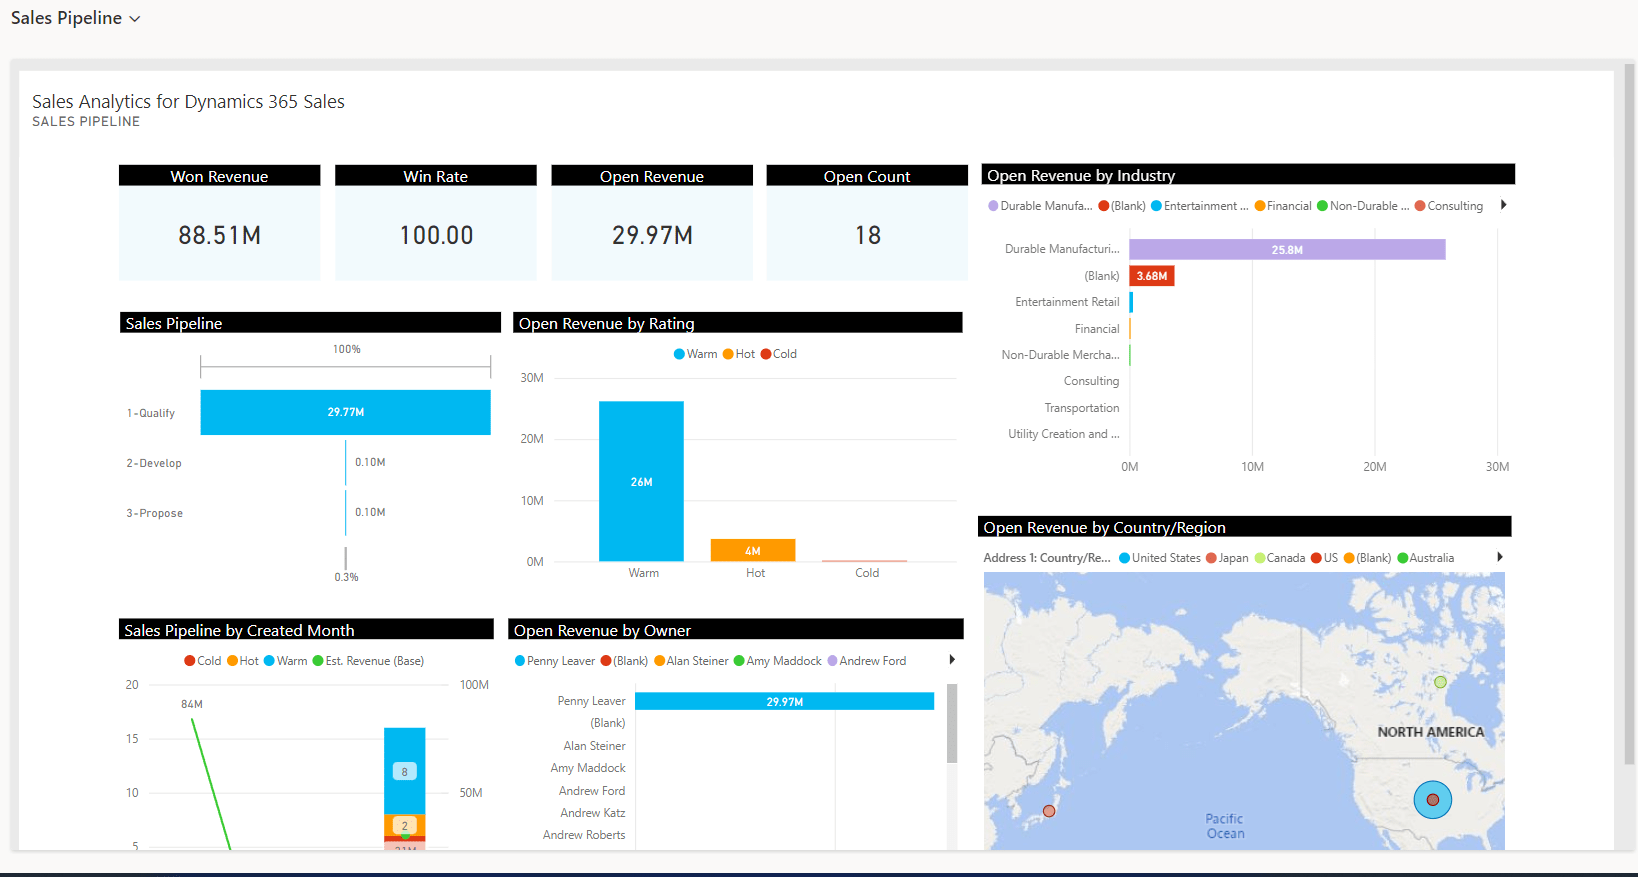
Integrating Power BI Online dashboards into D365 CRM is quick and easy. In three mouse-clicks, you can create a Dynamics Dashboard fed by Microsoft Power BI. When source data changes within Power BI, so does the Dynamics 365 Dashboard in real-time. Additionally, Power BI offers mobile-friendly reports with the base solution. Therefore, adapting an existing report to a mobile UI is a matter of mouse-clicks, not a complete rebuild.
Power BI offers your business a wide range of benefits especially if you’re already using Microsoft 365 and Dynamics 365. Not only does it have industry-leading features and a user-friendly interface, the platform is offered at a competitive price making it easy for any user or business to get started. If you’re looking for an enhanced reporting solution that interfaces with your CRM system, we can help! Contact us today so we can arrange a time to discuss your project!
Power BI is designed to be user-friendly and accessible, even for those without a background in IT or data analysis. Here’s how it compares to other data visualization tools and the resources available for beginners:
Learning Curve: Power BI is often praised for its intuitive user interface and ease of use, especially for beginners. It’s estimated that a complete beginner will take about 4-6 weeks to learn Power BI. This learning duration might be shorter for those with previous work in other Business Intelligence tools such as Tableau and Google Data Studio.
Comparison with Other Tools: Power BI and Tableau are both popular business intelligence tools with a lot of overlap in terms of their capabilities. Power BI only works on Windows, whereas Tableau supports both Windows and MacOS. However, Power BI is generally considered more user-friendly and less expensive than Tableau. If you’re already accustomed to Microsoft products like Excel, you’ll find a similar look and feel in Power BI.
Resources for Beginners: Microsoft provides extensive documentation, tutorials, and video courses to help beginners learn and master Power BI. Microsoft Learn offers a training module for getting started with Power BI. There are also many online lessons and resources available for free.
Community Support: The Power BI community forums and user groups offer a platform to ask questions, continue your learning journey, and connect with fellow Power BI enthusiasts. You can also find Power BI projects and tutorials on various blogs and websites.
Integrating diverse data sources into Power BI is generally a seamless process, thanks to the platform’s extensive connector library. However, there can be challenges and considerations:
Data Compatibility: Power BI can connect to a wide range of data sources, but the data must be in a format that Power BI can understand. This might require some data transformation or cleaning before it can be used effectively.
Data Quality: Issues such as duplicate records, inconsistent formatting, and missing values can affect the quality of the data. Power BI provides tools for identifying and resolving these issues.
Performance Issues: Large tables and too many columns can impact the performance of your Power BI report. It’s important to optimize your data model to ensure good performance.
Data Errors: When two or more tables have conflicting data, it can result in errors when merging. It’s crucial to ensure the accuracy of the data in each source before attempting to merge.
Joining Incorrect Tables: Joining the wrong table or using the wrong join type can cause data errors or result in inaccurate analysis.
Power BI provides several features to address these challenges:
Data Transformation Tools: Power BI includes Power Query, a powerful data connection and transformation tool that can clean and reshape data from various sources.
Data Modeling: Power BI allows you to create relationships between different tables of data, which can help when merging data from various systems.
Data Quality Checks: Power BI provides several tools for identifying and resolving data quality issues, including the Query Editor and data modeling tools.
Community Support: The Power BI community forums and user groups offer a platform to ask questions, continue your learning journey, and connect with fellow Power BI enthusiasts.
Successful data integration in Power BI involves careful planning, understanding your data sources, and using the right tools and techniques to prepare your data. It’s also important to continually monitor and maintain your data to ensure its quality and accuracy.
Microsoft takes a structured approach to ensure that updates to Power BI enhance the user experience without disrupting existing workflows or reports. Here’s how:
As for the future-proofing of Power BI, it’s considered a future-proof platform for the next 10 years. Power BI is a Microsoft product, and a range of products from Microsoft are already global leaders. Integration with Power BI bodes well for its users as the brand ensures it is here to stay, adding features at a steady pace.
In terms of support for adapting to new features or changes in the data analytics landscape, users can expect:
TrellisPoint is a Microsoft Dynamics 365 Consulting firm with locations in Cleveland and Cincinnati. As a Microsoft Gold Partner, TrellisPoint is dedicated to helping customers drive digital transformation by implementing and integrating Microsoft Dynamics 365, the Power Platform and related customer experience applications. Additional services include on-premises to cloud migration, software development, and managed services including Dynamics 365 Support.
